Monitoring PostgreSQL performance is an essential part of maintaining a successful database environment. Without proper monitoring, organizations may not be aware of critical issues that could affect their database operations and result in costly outages or service disruptions. Fortunately, there are a number of tools available to help administrators and developers monitor PostgreSQL performance effectively.
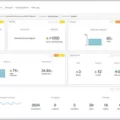
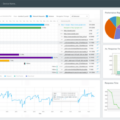
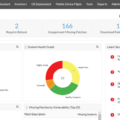
One of the most effective tools for monitoring PostgreSQL is the database health dashboard. This dashboard provides insight into how well your PostgreSQL instance is performing by providing metrics such as average query response time, open connections, database size, and cache-hit ratios. It also helps to identify any potential issues with your database configuration such as unused indexes, slow queries, or inefficient use of resources.
To ensure that your PostgreSQL instance is running at its best, it’s important to regularly monitor both the server and application-level performance. You can use the database health dashboard to quickly identify any problems or areas where improvement can be made. For example, it can help you identify slow queries that are causing delays in responding to user requests or detect inefficient use of resources due to incorrect configuration settings.
In addition to using a database health dashboard for monitoring PostgreSQL performance, you can also run additional checks such as scanning for unused indexes or inspecting database caches. These checks will help you ensure that your database is optimized for maximum efficiency and performance.
Finally, there are a number of third-party applications available that provide additional support for monitoring PostgreSQL performance such as Apache Superset and Grafana Cloud. These applications allow you to easily create custom dashboards and alerts tailored specifically for monitoring your PostgreSQL instance. With these tools at your disposal, you’ll be able to keep your PostgreSQL instance running smoothly with minimal effort on your part.

Monitoring a PostgreSQL Database
Monitoring a PostgreSQL database is an important task for ensuring optimal performance and making sure that the system is running efficiently. To monitor PostgreSQL databases, you should use a database health dashboard to analyze average query performance, check for open connections, determine the size of the database, calculate cache hit ratios, scan for unused indexes, and inspect the database caches.
To get started with monitoring your PostgreSQL database, you will need to install a health dashboard onto your system. This dashboard should be designed to provide useful metrics such as query times and throughputs. It will also include information about open connections and active queries. Additionally, it should provide visibility into the size of the database and any disk space used by the system.
Once your dashboard is installed and configured properly, you can begin analyzing query performance on your PostgreSQL server. By looking at average query times or throughputs over a certain period of time — such as minutes or hours — you can quickly identify any trends in slow response times or long wait times for queries. Additionally, it’s important to check for open connections so that you can make sure that no queries are left running unnecessarily, which can reduce overall performance if left unchecked.
You can also use your health dashboard to determine the size of your PostgreSQL database. The size of a PostgreSQL database includes both data stored in tables as well as any other files associated with the system such as log files or configuration settings. Knowing how much space is being utilized on disk allows you to plan ahead when adding new data or making changes to existing data structures.
In addition to determining the size of your PostgreSQL database, it’s also important to calculate cache-hit ratios in order to evaluate how efficiently the system is using memory resources. Cache-hits are when requests are satisfied using information already stored in memory rather than retrieving information from disk storage; this reduces latency times associated with accessing data from disk storage and helps improve overall system performance. You can use your health dashboard to calculate cache-hit ratios over time in order to identify any issues with inefficient memory utilization or excessive disk accesses that could be causing slowdowns within your system.
Your monitoring setup should also include scans for unused indexes which may be taking up space unnecessarily on disk and leading to slower response times when queries are run against these tables due to extra overhead associated with scanning over these unneeded indexes during query execution plans. Additionally, inspect the Database Caches periodically so that you can ensure that only necessary information is kept in memory rather than having outdated or unnecessary data taking up resources unnecessarily which could reduce overall system performance over time if not addressed accordingly.
By following these steps and leveraging a comprehensive health dashboard solution designed specifically for monitoring PostgreSQL databases like PgDash Pro, you will be able to keep an eye on key metrics associated with your DBMS while ensuring optimal performance across all operations on your system at all times!
Checking PostgreSQL Activity
To check PostgreSQL activity, you can use either the “pg_stat_activity” system view or pgAdmin’s “Server Activity panel”. Both of these approaches will provide information about currently executing queries and other details, such as the user and client host for each session.
The “pg_stat_activity” view is a system view that contains information about all active server processes. It includes fields such as query start time, process id, user name, client hostname, and more. To access it, connect to your Postgres database with a command-line tool or an administrative UI tool like pgAdmin and execute a query against the “pg_stat_activity” view.
The Server Activity panel in pgAdmin is a graphical interface that displays all active sessions on your Postgres server. The panel can be accessed from the Tools menu in pgAdmin. It shows useful information such as the session start time, the current state of each process (e.g., idle in a transaction), and the user name and client host for each connection. You can also see which queries are currently being executed by each session by selecting them from the Process List tab.
By using either of these approaches you can quickly find out which queries are running on your Postgres server at any given moment and gain valuable insight into how it is being utilized by your users.
Choosing the Best PostgreSQL Reporting Tool
The best PostgreSQL reporting tool is Apache Superset. Apache Superset is an open-source reporting tool that provides powerful integration support with multiple databases, including PostgreSQL. It offers users a variety of features, including:
• Easy setup and integration with PostgreSQL databases
• Data visualization capabilities to quickly create charts and graphs
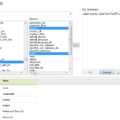
• SQL Lab for users to write and execute SQL queries on the fly
• Ability to easily export data into various formats (CSV, JSON, etc.)
• Advanced security features such as authentication and encryption of data
• Robust access control system to manage user permissions
• Support for custom dashboards and visualizations
• Advanced query optimization techniques for efficient data retrieval.
Overall, Apache Superset is a great choice for PostgreSQL reporting due to its comprehensive feature set, robust security features, and excellent integration support.
Monitoring PostgreSQL with Grafana
Monitoring PostgreSQL with Grafana is a simple and effective way to ensure the health of your PostgreSQL database. With Grafana, you can set up customized dashboards and alerts to stay on top of how your database is performing.
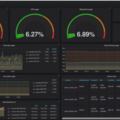
To get started, sign up for a free Grafana Cloud account. Once you’ve registered, run a one-line command to install the Grafana Agent. This will immediately provide you with pre-built Grafana dashboards tailored specifically for monitoring PostgreSQL.
Grafana’s intuitive interface makes it easy to create custom dashboards that show various metrics about your database such as query performance, disk usage, CPU utilization, and more. You can even set up powerful alerts so that you are notified if something goes wrong with your database or if there are any suspicious activities taking place.
In addition to monitoring PostgreSQL, Grafana can also be used to monitor other databases such as MySQL and MongoDB. If you need help getting started, check out the official Grafana documentation or reach out to their support team for assistance.
Monitoring PostgreSQL
When monitoring PostgreSQL, it is important to keep track of both system resource usage and database health. System resource monitoring should include metrics such as CPU and memory utilization, as well as disk I/O activity. Additionally, database monitoring should be used to ensure that the database is operating optimally by tracking metrics such as query response times, query throughput, locks, replication delays, user connections, and more. Additionally, you should monitor your database for any unexpected changes or errors which could indicate an issue with your database. By monitoring these components of your PostgreSQL infrastructure, you can ensure that it is running smoothly and efficiently.
Conclusion
In conclusion, PostgreSQL monitoring is an essential part of maintaining a healthy and secure database. With the right tools, you can monitor your PostgreSQL performance, track open connections, determine the size of a PostgreSQL database, calculate cache-hit ratios, scan for unused indexes, inspect database caches, and more. Apache Superset and Grafana Cloud are popular options for monitoring PostgreSQL databases. However, it’s best to compare features and functionality to ensure you choose the right tool for your specific needs. With the right tool in place, you can ensure your PostgreSQL database is running smoothly and efficiently at all times.

