Inspect Element is a powerful tool for web developers and designers that enables them to easily inspect and debug web elements on actual iPads and iPhones. In this blog post, we will walk you through the steps to enable Inspect Element on your iPad, so you can start debugging your web elements right away.
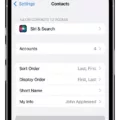
First of all, you need to connect your iPad or iPhone to your Mac. Once connected, open up the Settings app and navigate to Safari > Advanced and toggle on Web Inspector. This will enable the Inspect Element feature in Safari on your iPad or iPhone.
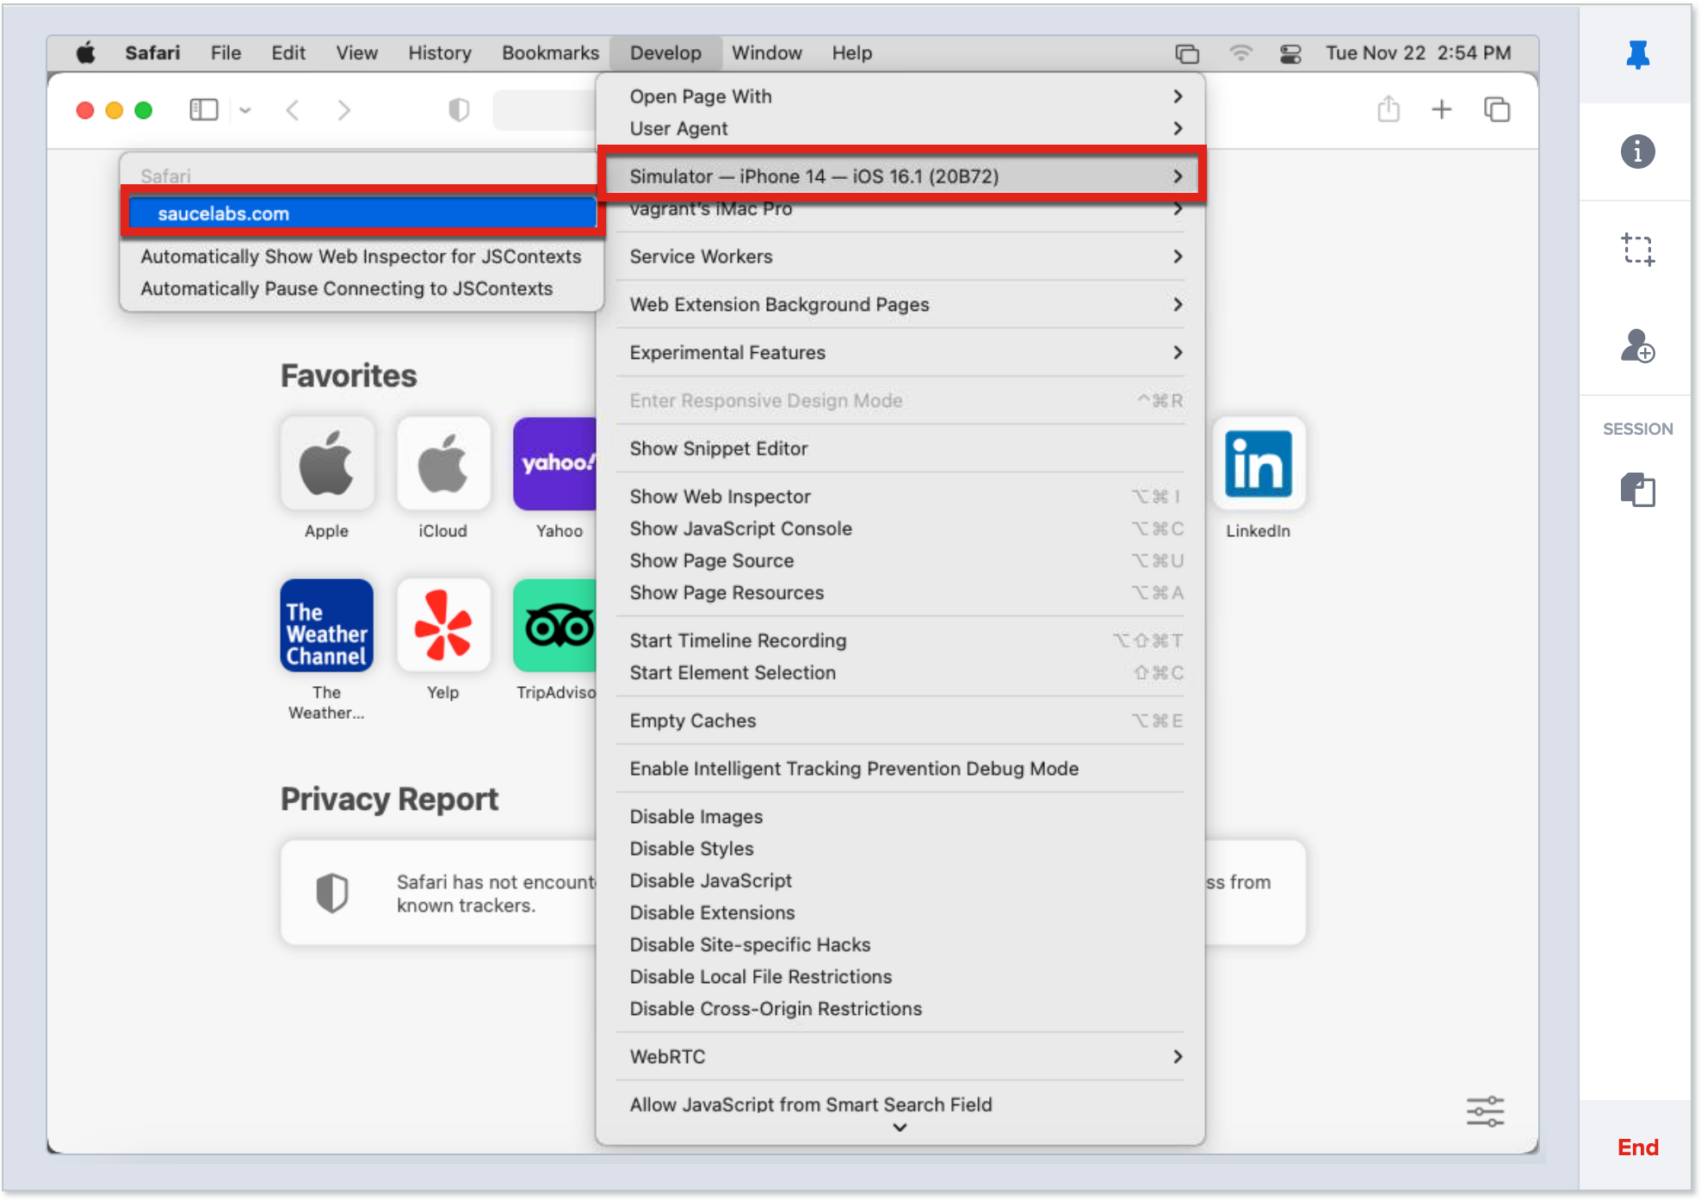
Next, launch Safari on your Mac and go to Safari menu > Preferences > Advanced then check ‘Show Develop menu in menu bar’. This will allow you to replicate and debug issues on a current device with ease.
Finally, open Chrome on your iPad or iPhone, go to chrome://inspect then press Start Logging. Now you can do whatever task you need in another tab while keeping the Chrome tab open – anytime you come back any console outputs will be visible for an inspection!
Inspect Element is a great feature that allows developers and designers alike to quickly debug issues on mobile devices such as iPads and iPhones. With just a few easy steps as outlined above, you can now use Inspect Element on your iPad too!
Inspecting Element on iPad
Yes, you can inspect elements on an iPad. Apple provides a feature called the Web Inspector that enables web developers to debug and inspect web elements on actual iPads and iPhones. To get started, all you need to do is connect your iPhone to your Mac computer and enable Web Inspector. Keep in mind that this feature only works on an actual Apple Mac, not on Safari running on Windows.
Once enabled, you will be able to use the Web Inspector tool to inspect various elements of a website or web application. This includes examining HTML elements, viewing associated CSS styles, evaluating JavaScript code performance, testing the impact of changes made in real-time, and more. With this feature, you can quickly troubleshoot any issues with your website or web app before it goes live.
Inspecting in Safari on iPad
In order to inspect Safari on iPad, you must first enable the Web Inspector feature. To do this, go to your Settings app, tap Safari, then Advanced, and toggle on the Web Inspector option. Once enabled, connect your iPad to your Mac computer using a USB cable. Open Safari on your Mac and select Develop in the menu bar at the top of the screen. In the dropdown list that appears, select your iPad device and you should now see a list of websites you have open on your iPad. Select one of these sites to begin inspecting. You will be able to view and edit HTML, CSS, and JavaScript on the page as well as access other developer tools such as console logging.
Inspecting a Page in Chrome on iPad
Inspecting a page in Chrome on iPad is easy! To do so, first, open the Chrome app and navigate to the page you would like to inspect. Once there, go to chrome://inspect and press Start Logging. This will start logging any console output from the page you are inspecting, so you can come back anytime to review it. You can now go do your thing in another tab keeping this tab open as it will log any console output for you. When finished, you can go back to the tab with chrome://inspect and review the console output for further inspection.
Inspecting Element on Tablet
Yes, it’s possible to inspect elements on a tablet. You can do this using a web browser’s developer tools, which are available on most modern browsers such as Chrome, Safari, and Firefox. To access the developer tools on a tablet, open the browser and press the button combination of “Ctrl + Shift + I” (on Windows) or “Cmd + Opt + I” (on Mac). This will open up the DevTools pane, which allows you to inspect web elements and make changes to HTML and CSS code.
Opening Developer Tools in Safari on iPad
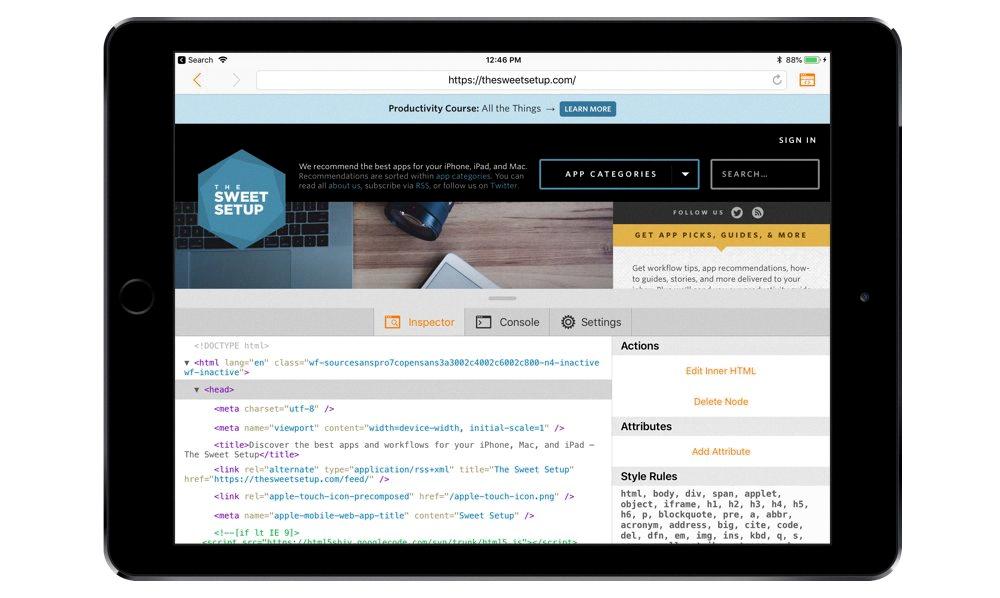
Opening the developer tools in Safari on iPad is relatively easy. First, open Settings and scroll down to Safari. Select Advanced and toggle the Web Inspector switch to ON. After doing this, the Develop menu will be available in the Menu Bar when you open Safari on your iPad. To access the Developer Tools, select Develop from the Menu Bar and select Show Web Inspector. This will open a panel with a variety of tools that can help you debug webpages or develop websites from your iPad.
Source: thesweetsetup.com
Inspecting Element on Safari Without a Computer on iPad
In order to inspect elements in Safari without a computer on an iPad, you need to first download and install the Shortcuts application from the App Store. Once it is installed, you simply need to launch it and install the ‘Edit Web Page’ shortcut. With this installed, you can now open Safari on your iPad and click on the Share button in the top right corner. You will then see an option to ‘Run Shortcut’, which when selected will open up a web inspector window. From here, you can view all of the elements of the page such as HTML code, CSS stylesheets, JavaScript files, and even images. To make changes to any of these elements simply click on them and start editing them directly in Safari.
Opening Developer Tools in Chrome on iPad
Opening Developer Tools in Chrome on iPad requires a few steps. First, open the Chrome app on your iPad and tap the three-dot icon in the top right corner. Then, select Settings from the drop-down menu. Scroll down until you see Advanced and tap it. Under Advanced you will see Developer Tools; make sure it is toggled on. Then, while on any page in Chrome, press and hold the refresh button at the top of the browser window until a new menu appears. Select Request Desktop Site from this menu to enable Developer Tools. Once enabled, you can access Developer Tools by tapping the three-dot icon again and selecting More Tools > Developer Tools from the drop-down menu.
Inspecting Element on Safari
Yes, you can inspect elements on Safari. To do this, open your Safari menu bar and click on Safari > Preferences. Then select the Advanced tab. In the Advanced tab, you will find an option to enable the Develop Menu in the menu bar. Once enabled, you can right-click on any page and select Inspect Element to open the Web Inspector window which provides a detailed view of the page’s source code and allows you to make changes or view information about that element.
Conclusion
In conclusion, inspecting elements on iPad is a great tool for web developers to debug and inspect web elements directly from their iPad. It is easy to use and requires just a few steps. First, connect the iPad to your Mac and enable the Web Inspector. Then, enable the Develop Menu in Safari’s Preferences. Finally, open Chrome on your iPad or iPhone and go to chrome://inspect, then press Start Logging. With this feature, web developers can replicate any issue they encounter while testing their websites in the actual device environment, making it easier to diagnose and fix bugs quickly.


