Are you a web developer looking to take your skills to the next level? If so, then the Safari Debug Menu is just what you need!
For those unfamiliar with it, the Safari Debug Menu is an incredibly powerful tool for web developers. It provides a wealth of features that allow developers to modify, debug, and optimize their websites for peak performance and compatibility on both platforms.
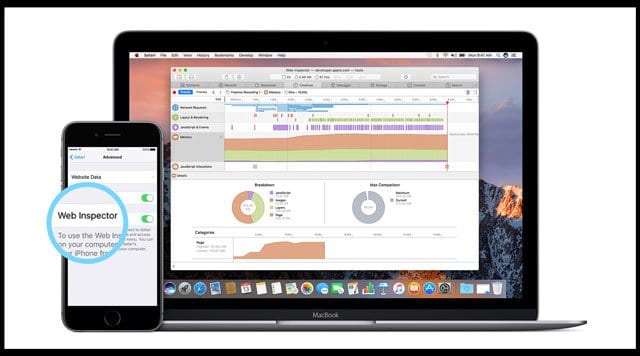
First and foremost, Safari includes Web Inspector – a powerful tool that makes it easy to inspect the HTML, CSS, and JavaScript components of any webpage. With it, developers are able to examine the source code of any page they visit. This makes it easy to identify issues and make adjustments as needed.
The Debug Menu also offers Responsive Design Mode – a feature that allows developers to preview their pages in various screen sizes, orientations, and resolutions. This is particularly helpful when building sites that must look good on all types of devices.
For even more debugging options, Safari also offers Error Console – a feature that displays errors in real-time while websites are being tested or used. This helps catch issues before they become major problems on production sites.
Finally, the Debug Menu includes Timeline – a feature that provides a detailed analysis of page loading times by displaying individual page elements as well as overall page load times in graph form. This helps developers identify potential bottlenecks in their code that could be slowing down their website’s performance.
All in all, the Safari Debug Menu is an essential tool for any serious web developer who wants to take their skills to the next level. So if you haven’t already done so, make sure to check out this amazing tool today!

Opening the Debug Menu on a Mac
To open the Debug menu on a Mac, you will need to first close Safari. Then, go to System Preferences > Security & Privacy and grant Full Disk Access to Terminal. After that, open Terminal and type in the command: defaults write com.apple.Safari IncludeInternalDebugMenu 1 and press enter to run the command. Finally, open Safari again and you should now see the Debug menu visible.
Debugging in Safari
The debugger in Safari is located in the Develop menu, which can be accessed by going to Safari > Preferences > Advanced > Develop. Once you have activated the developer mode, select “Show Error Console” to open the console and access the debugger.
Does Safari Have A Debugger?
Yes, Safari does have a debugger. The Web Inspector feature in Safari allows you to debug and optimize webpages for peak performance and compatibility with both macOS and iOS devices. You can use Web Inspector to pause the execution of JavaScript code, step through your code line by line, view and edit DOM elements, analyze network requests and responses, inspect resources loaded into the page, identify errors in your HTML/CSS/JS code, and more. Additionally, Safari’s Responsive Design Mode lets you preview how your webpages look on various devices with different screen sizes, orientations, and resolutions.
Conclusion
The Safari Debug Menu is a powerful tool that provides web developers with the ability to debug their websites and optimize them for performance and compatibility. It includes Web Inspector, which allows you to modify, debug and optimize your website, as well as Responsive Design Mode, which enables you to preview pages in different screen sizes, orientations, and resolutions. With this powerful tool, developers can easily detect errors in their websites and make necessary changes to ensure the best performance for their users.


