Debugging Your Website in iOS Safari on Windows 10

Share This:
Debugging Your Website in iOS Safari on Windows 10 1
Debug a Website in iOS Safari

Debugging a website in iOS Safari on Windows 10 can be a tricky task, but with the right tools and techniques, it doesn’t have to be. In this blog post, we’ll take a look at how to debug websites in iOS Safari on Windows 10 using tools like Remote Debugging and Web Inspector.

First of all, you’ll need to install the Scoop package management software for Windows. This will allow you to easily install the necessary tools for debugging your website in iOS Safari.

Once you have installed Scoop, you’ll need to enable the Safari Web Inspector on your iOS device (iPhone or iPad). To do this, connect your device to your PC and trust it from the device settings. Next, run remotedebug_ios_webkit_adapter from your PC. This will allow remote debugging from your Windows PC.

Once you have enabled the Web Inspector on your device and set up remote debugging correctly, you can begin debugging your website. To do this, open up Safari on your Mac and go to Preferences > Advanced > Develop > Show Error Console. This will open up the debug console menu where you can view any errors that occur while loading your website in iOS Safari.

In addition to viewing errors, the Web Inspector also gives you access to various other information about how your website is being rendered in iOS Safari such as network requests and performance metrics. You can use this information to troubleshoot any issues that may arise while developing or testing your website in iOS Safari on Windows 10.

Debugging Your Website in iOS Safari on Windows 10 3

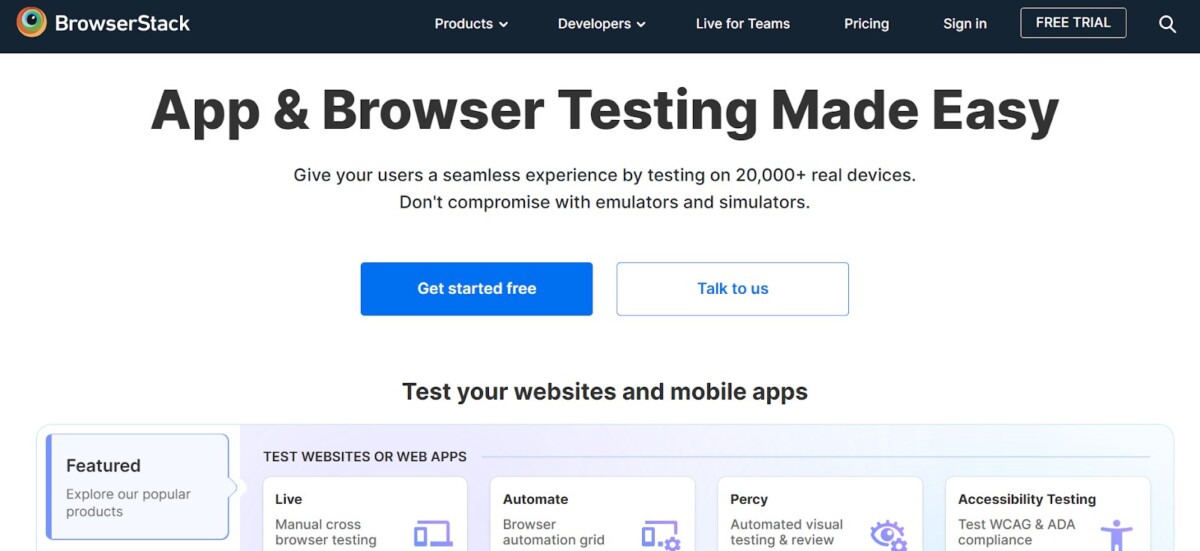
Finally, if you don’t want to use the Web Inspector directly or are having trouble setting it up correctly, there are services such as BrowserStack that make iPhone Safari debugging simple no matter what operating system is being used. With BrowserStack, users can test and debug their website on their desired iPhone – Safari combination directly from their web browser (Firefox, Chrome, etc).

Overall, debugging a website in iOS Safari on Windows 10 can prove difficult but with the right tools and techniques, it doesn’t have to be complicated! Doing it correctly will save time and effort when testing or developing websites for mobile devices running Apple’s iOS platform.

Yes, you can debug iOS on Windows using BrowserStack. BrowserStack is a popular web-based platform that enables users to test and debug their websites and apps on a wide range of browsers, operating systems, and devices, including iPhone Safari. With BrowserStack, Windows users (on Windows XP, 7, 8, 10) can directly launch an iPhone Safari instance from their web browser (Firefox, Chrome, Safari, etc.) and begin debugging right away.

Debugging features include the ability to view the page source, debug JavaScript errors, and inspect element styles. Additionally, you can also take screenshots of your website or app running on different iPhones while debugging. This helps in quickly identifying page layout issues or other issues due to device-specific quirks.

Debugging iOS in Safari

To debug iOS in Safari, you need to use Web Inspector. First, on your iPad, iPhone, or iPod touch, go to Settings > Safari > Advanced and toggle on Web Inspector. On your Mac, launch Safari and go to Safari menu > Preferences > Advanced then check ‘Show Develop menu in the menu bar’ if not already enabled.

Debugging Your Website in iOS Safari on Windows 10 5
Debugging iOS in Safari

Once Web Inspector is set up properly, connect your device to the Mac using a USB cable and open the page you want to debug on the device. Then go to the Develop menu in Safari on your Mac and select your device from the list. You should now be able to inspect and debug HTML and JavaScript running on the connected device.

Debugging a Website in Safari

To debug a website in Safari, you must first activate the Developer mode. To do this, open Safari’s Preferences, then select Advanced. Under Advanced, select the Develop tab and check the box next to “Show Error Console”.

After activating the Developer mode, reload the website you are attempting to debug. Any errors or warnings will appear in the Error Console, which can be accessed by selecting Develop > Show Error Console from the Safari menu bar. Once you have identified any errors or warnings in the console, you can investigate and attempt to solve them accordingly.

Debugging Safari Browser in Windows

Debugging Safari browser in Windows is possible with the help of the Apple Remote Debugging Tool. This tool is available for free download in the App Store. To use it, you will first need to connect your device (iPhone or iPad) to a Windows machine via USB. Once connected, open Safari on the device and navigate to Settings > Safari > Advanced, and enable the Web Inspector toggle button. You can then open Web Inspector on Windows by going to Develop > iPhone (or iPad) in the Safari menu bar.

Here you can view HTML, CSS, JavaScript code, and other elements of the page being viewed on the device. Additionally, you can debug using breakpoints and step through code execution as well as view console logs and network requests from within Web Inspector.

Debugging Your Website in iOS Safari on Windows 10 7
Debugging Safari Browser in Windows

Does Windows 10 Include Debugging Tools?

Yes, Windows 10 does have debug capabilities. The Debugger feature is included in the Windows SDK (Software Development Kit) and can be used to debug programs and scripts. With the Debugger, users can set breakpoints, step through code, watch variables, and inspect memory. The Debugger also includes commands to set, modify, display, load, and save settings.

Inspecting Element on iOS

To inspect elements in iOS, you will first need to plug in your physical device. Next, enable the “Show Develop menu” option in Safari. Once this is enabled, open your desired website and you will find a “Develop” option under the Settings menu.

Click on that and you will be able to access all the web inspector tools available for iOS devices. By using these tools, you can replicate and debug issues on the current device. Additionally, you can also inspect elements on your page by selecting them from the list of DOM nodes or using the search bar at the top of the web inspector panel.

Debugging Mode in iOS

Debug mode in iOS is a feature that allows developers to view detailed logs of Tapjoy actions in the Tapjoy Developer Console. This setting also enables logging into the Xcode console, which provides developers with more detailed information about those actions. Debug mode can be used to monitor and troubleshoot events such as user sessions, placements, purchases, custom events, etc.

Debugging Mode in iOS

Enabling Inspect Mode on an iPhone

In order to put your iPhone into Inspect mode, you’ll need to access the Advanced settings found in Safari. To do this, tap the Settings icon on the Home screen of your iPhone. Scroll down until you reach Safari and tap on it to open the settings page.

Scroll to the bottom of the page and tap the Advanced menu. Then toggle the slider next to Web Inspector to the On position. This will enable Inspect mode for your iPhone, allowing you to view website source code, debug JavaScript, and more.

How do I debug Safari mobile browser?

To debug Safari on an iPhone effectively, enable Web Inspector on your device to facilitate debugging interactions. This feature is crucial for developers aiming to debug web apps directly on Safari.

For a seamless cross-platform debugging experience, integrating tools like the iOS WebKit Debug Proxy and the RemoteDebug iOS Webkit Adapter is essential. These tools bridge the gap between Safari on iOS and the Chrome browser on your desktop, allowing you to use Chrome DevTools for debugging.

Debugging Your Website in iOS Safari on Windows 10 10
How do I debug Safari mobile browser?

Installation of the iOS WebKit Debug Proxy can be streamlined on Windows through the command scoop bucket add extras, which prepares your system for the proxy installation. This setup is pivotal for developers requiring deep insights into the workings of their web apps on actual device.

By ensuring Apple Mobile Device Support is installed, your system can recognize and communicate with the iOS device. Once everything is in place, opening Google Chrome and navigating to chrome://inspect reveals the connected iOS device, ready for debugging with Chrome DevTools. This method provides a powerful and efficient way to debug iPhone Safari, leveraging familiar tools and protocols to diagnose and enhance your web app.

Running a Website in Debug Mode

To run a website in debug mode, you will need to open the developer mode in your browser. On Chrome, you can do this by pressing F12. This will open the developer tools, where you can see the source code of the page.

Once you have opened the code, set a breakpoint at the beginning of the script and click on the button or menu that triggers your desired action. The debugger will then pause at each line of code and allow you to inspect each step of its execution, which should help you pinpoint any errors or bugs in your website’s code.

Does Safari Have A Developer Console?

Yes, Safari has a developer console. To access it, you need to first enable the Developer Menu by going into Safari’s preferences (Safari Menu > Preferences) and selecting the Advanced Tab. Once enabled, you can find the developer console by clicking on Develop > Show Javascript Console. The developer console is a powerful tool that allows web developers to debug and inspect webpages they are working on.

Conclusion

In conclusion, debugging a website in iOS Safari on Windows 10 is possible with a few simple steps. First, install Scoop, a package manager software for Windows. Then enable Safari’s Web Inspector on iOS (iPhone) and connect the iPhone to the PC and trust the device.

Lastly, run the remotedebug_ios_webkit_adapter. Additionally, with BrowserStack you can test and debug directly from your web browser (Firefox, Chrome, Safari, etc). Lastly, to debug errors using the Safari debug console menu you must activate the developer mode in Safari > Preferences > Advanced > Develop > Show Error Console. With these steps, you can easily debug websites on iOS Safari on Windows 10.

Share This:
Photo of author

Alex Sterling

Alex Sterling is a seasoned tech enthusiast and a passionate advocate for all things innovation. With a keen eye for detail and a knack for simplifying complex concepts, Alex has been at the forefront of exploring the ever-evolving world of technology. From practical tech guides to insightful reviews, Alex's expertise spans across a wide range of topics, including cutting-edge gadgets, software solutions, and the latest trends shaping the digital landscape. With a commitment to empowering readers to navigate the digital world with confidence and ease, Alex's contributions to DeviceMAG aim to unravel the mysteries of technology and inspire curiosity in tech enthusiasts of all levels.

1 thought on “Debugging Your Website in iOS Safari on Windows 10”

Leave a Comment

This site uses Akismet to reduce spam. Learn how your comment data is processed.