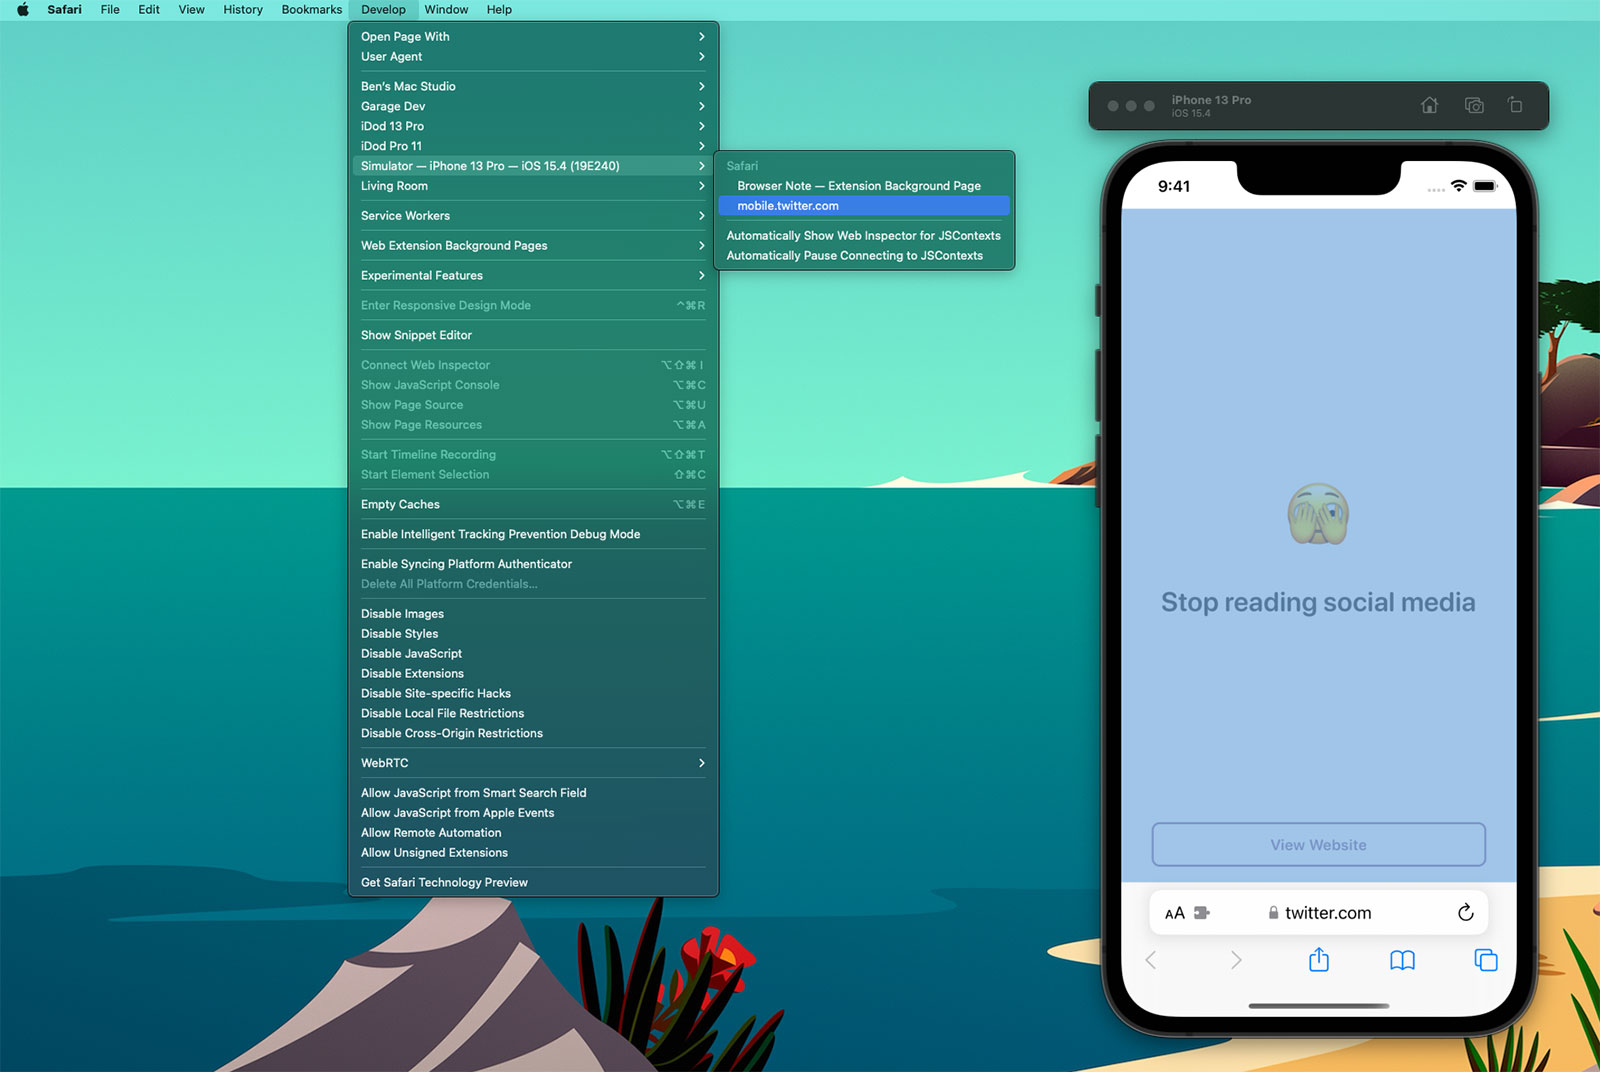
Safari Simulator is an innovative tool for developers that enables them to easily test and debug their web applications on Apple’s iOS devices. With the help of Safari Simulator, developers can get a sense of how their applications look and perform on different versions of Apple’s mobile operating system. This is especially useful when developing websites and applications for multiple platforms.
In addition to testing the look and feel of a website or application, developers can use the Safari Simulator to inspect elements in their web pages. This allows them to identify any potential issues before they launch the application or website in production. Inspecting elements can be done in two ways: through Safari Web Inspector and Appium Inspector.
The Safari Web Inspector is an integrated development environment that allows developers to debug websites using JavaScript, HTML, and CSS. It also provides insight into the performance of a website or application, allowing developers to make sure it’s optimized for peak performance on iOS devices. Additionally, with Responsive Design Mode, developers can preview their webpages in various screen sizes, orientations, and resolutions without having to switch between multiple devices or browsers.
Appium Inspector is another tool for inspecting elements in Safari Simulator. Appium allows developers to inspect elements both on Android and iOS platforms with ease. To use Appium Inspector with the Safari Simulator there are five steps involved: opening the iOS simulator; getting “udid”; getting the OS version; opening Appium Inspector; connecting the Appium inspector with Simulator.
Overall, Safari Simulator is an incredibly useful tool for web developers testing websites or applications on multiple platforms. It provides them with powerful debugging capabilities such as element inspection through Safari Web Inspector or Appium inspector—allowing them to quickly identify any potential issues before they launch their product in production.

Using Safari Simulator
Using Safari Simulator is a great way to test web apps and websites on different iPhone and iPad devices. Here are the steps for getting started:
1. Install XCode on your Mac – this is a free development tool from Apple that you will use to launch the iOS Simulator.
2. Once installed, open the iOS Simulator from XCode – you can find it in the ‘Open Developer Tool’ menu.
3. Once the simulator opens, open the Safari browser by clicking its icon in the dock or launching it from Spotlight Search.
4. From here, you can start navigating to different websites as if you were using an actual iPhone or iPad device! You can also use Safari’s developer tools to simulate various conditions like connection speed and viewport size, which is great for testing how your website looks on different devices and connections.
5. If you want to debug a website while using Safari Simulator, you can connect your Mac’s Safari browser with the one in the simulator by enabling ‘Develop > Web Inspector’ in both browsers. This will give you access to all of Safari’s debugging features like HTML/CSS inspection and JavaScript console logging.
Safari Simulator is an incredibly useful tool for quickly testing websites and apps on different devices without having to buy each device separately. By following these steps, you should be able to get started with using it in no time!
Inspecting Elements in Simulator
In order to inspect elements in the simulator, you will need to first open the iOS simulator. To do this, go to the Applications folder and select Xcode > Open Developer Tools > iOS Simulator.
Once you have the simulator open, you will need to get the Unique Device Identifier (UDID) from your device. This can be found by going to Windows> Devices and Simulators in Xcode. The UDID is listed next to the name of your device.
Next, you will need to get the OS version that is running on your simulator. This can be done by selecting About from the home screen of your device or by going into Settings > General > About.
After obtaining both the UDID and OS version, you can now open Appium Inspector. Once Appium Inspector is open, you will need to connect it to your simulator by entering both the UDID and OS version that you acquired earlier.
Now that Appium Inspector is connected to your simulator, you can start inspecting elements within it! When inspecting an element in Appium Inspector, it will show both its unique identifier as well as its attributes such as class name and x-path which can be used for automation testing within Appium.
Does Safari Have an Inspector?
Yes, Safari does have an inspector. Web Inspector is a powerful tool that makes it easy to modify, debug, and optimize websites for peak performance and compatibility on both MacOS and iOS platforms. With Responsive Design Mode, you can preview your web pages in various screen sizes, orientations, and resolutions. Web Inspector also gives developers access to the underlying HTML, CSS, and JavaScript code of any page they are viewing. Additionally, it can be used to identify performance bottlenecks on a website or troubleshoot compatibility issues across different devices. Web Inspector makes it easier than ever to develop stunning websites that look great on all platforms.
Accessing the iOS Simulator
To access the iOS simulator, open Xcode and select your project from the left navigator. Next, select the [Platform] Simulators option from the run destination menu next to the scheme menu in the toolbar. This will display a list of available simulated devices, including iPhone and iPad models. Select the device you want to use for your simulation and press ‘Run’ to start it up. Once it’s running, you can interact with your app as if it were running on an actual device.
Inspecting Element on iOS
Yes, you can inspect elements on iOS. Apple provides a very intuitive feature that enables web developers to debug and inspect web elements on actual iPads and iPhones. To get started, simply connect your iPhone to your computer and enable the Web Inspector in Safari’s Develop menu. You will then be able to view the HTML elements, DOM trees, resources, and other information related to the website or web page you are viewing on your device. Additionally, you can preview changes live on your device as you make them in the Inspector. This makes it easier to identify problems and debug code without needing to constantly reload the page. With this tool, developers can easily find and fix errors, optimize their websites for mobile devices, and ensure that their sites look consistent across different browsers and operating systems.
Inspecting Element in Safari iOS
Inspecting elements on Safari iOS involves a few steps. First, you’ll need to enable the Web Inspector in your iPhone’s Settings app. To do this, open the Settings app, tap Safari, and then tap Advanced. Toggle the Web Inspector switch to turn it on. Once enabled, you can then move over to your Mac and open Safari. In the upper left corner of Safari, click on the Safari menu and select Preferences. From there, click Advanced in the navigation bar and check the box next to the Show Develop menu in the menu bar. This will add a new Develop menu to your menu bar.
After this is done, go back to your iPhone and open up Safari. Now when you press and hold down any element on the page for a few seconds (or use 3D Touch), you’ll see an Inspect Element option appear at the bottom of the menu that opens up. Tap it and it will open up a web inspector window which allows you to explore various elements on that web page in more detail. You can also use this inspector window to modify elements or delete them altogether if needed.
Location of IOS Simulator on Mac
The iOS Simulator is located within the Xcode application bundle, which is usually installed in the /Applications folder on your Mac. To open it, launch the Xcode application and then select the iOS Simulator option from the top menu bar. From there, you can choose which type of device you want to simulate and interact with your app as if it were running on an actual device.
Conclusion
In conclusion, Safari Simulator is a powerful tool that allows developers to test and debug websites for optimal performance and compatibility across both iOS and Mac. It provides a Responsive Design Mode which allows you to preview your website in different sizes, orientations, and resolutions. Additionally, it includes Web Inspector, an invaluable tool that makes it easy to modify, debug, and optimize web pages. With these features, Safari Simulator is an essential tool for any developer looking for the best possible performance from their website.


