Inspect Element is a powerful tool within web development that allows users to quickly and easily access the underlying elements of a website. By utilizing Inspect Element, web developers can make changes to a website’s HTML and CSS code in real time, allowing them to quickly make changes or fix bugs on their sites.
What is Inspect Element?
Inspect Element is an integrated feature within most modern web browsers that allows users to view and edit the HTML and CSS code of any given website. This makes it easy for developers to debug websites, test out new features, or even just explore how a website was built. It also makes it possible for non-developers to get an understanding of the structure of a website and learn more about HTML and CSS.
How do I open Inspect Element?
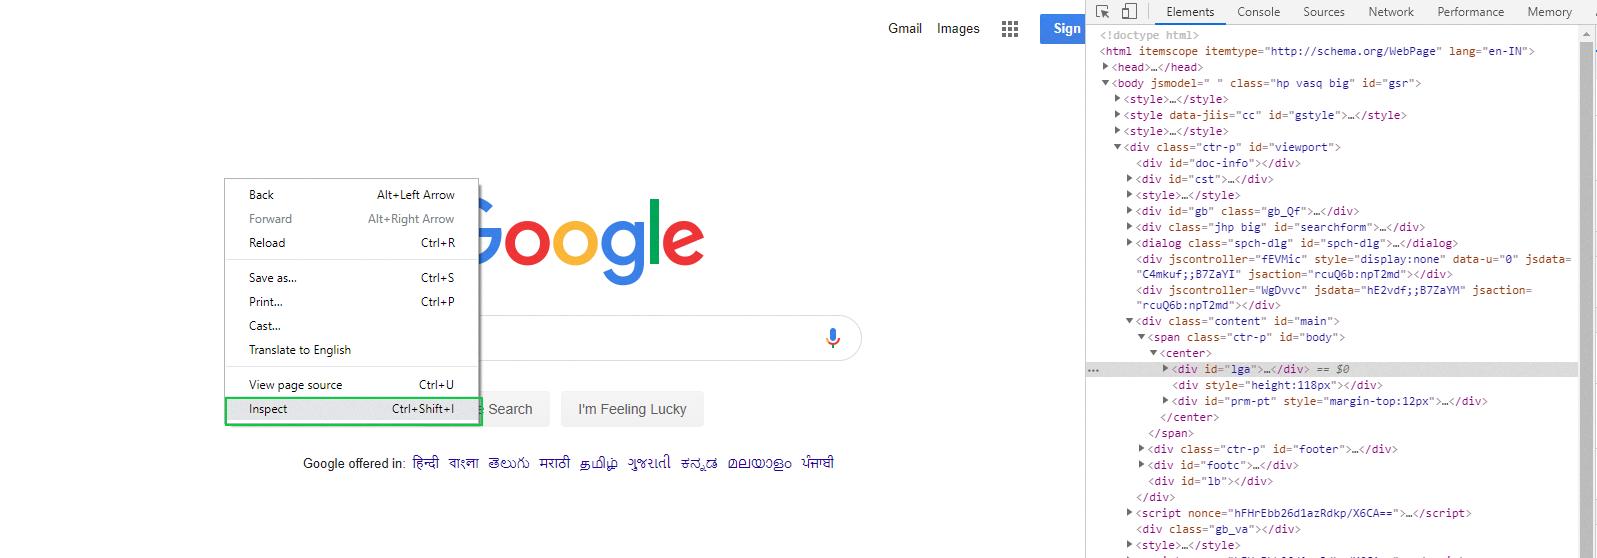
To open Inspect Element, right-click anywhere on the page you’d like to inspect and select “Inspect” from the context menu. Alternatively, you can use keyboard shortcuts such as “Ctrl+Shift+I” (on Windows) or “Command+Option+I” (on Mac). This will open up the browser’s developer tools in which you can inspect elements on the page.
Once open, you should see a panel containing two tabs: Elements and Console. In the Elements tab you will see all of the HTML code for the page bing inspected. The Console tab contains information about errors in your code or JavaScript commands that are being run on the page. You can use these tabs to view or edit any element on your page in real time by simply clicking on it with your mouse.
Conclusion
Inspect Element is an incredibly useful tool for any web developer lookng to debug their site or explore new features. With its easy accessibility via keyboard shortcuts or context menus, anyone with an understanding of HTML and CSS can take advantage of this powerful tool with minimal effort!
Opening Inspect Element in Chrome
To open Inspect Element in Chrome, frst open the Chrome browser and navigate to the webpage you want to inspect. Right-click anywhere on the page and select the “Inspect” option from the context menu. Alternatively, you can use keyboard shortcuts to open Inspect Element. On Windows, press Ctrl+Shift+I (or F12), on Mac press Cmd+Opt+I. Once you have opened Inspect Element, a window pane will appear at the bottom of your browser window. This pane contains all of the HTML elements that make up your webpage. From here, you can select an element and view or edit its HTML or CSS properties.

Source: geeksforgeeks.org
Opening Inspect Element
In order to open the Inspect Element panel on Android, you will need to access the Developer Options. To do this, go to your device’s Settings, then select System and About Phone. Scroll down to the Build Number section, and tap on it seven times. You will then see a message sayng that you are now a developer. Return back to your device’s main settings page and scroll down until you find Developer Options. Tap on it and you will see a few options related to debugging your device. Select USB Debugging and enable it by tapping on the toggle switch. Now connect your Android device to your computer via USB cable, open up Chrome browser on your computer, and press F12 (or Cmd+Alt+I for Mac users) to open the Inspect Element panel.
Opening Inspect Element in Windows 10
To open Inspect Element in Windows 10, you can use Developer Tools in your browser. To access this feature, open your browser and go to the Tools menu. If it is not visible, press Alt+X to display it. Once the menu is open, select Developer Tools. This will open a new window with a variety of tools, including the option to inspect elements on a web page. To do this, right-click anyhere on the page and select Inspect Element from the context menu that appears. You can then view and edit HTML elements on the page and make changes to their attributes as needed.
Opening Inspect Element Using Ctrl
To open the Inspect Element tool in Chrome, you’ll need to press a combination of keys on your keyboard. On Linux, press CTRL + SHIFT + C or F12 on Windows. If you’re using a Mac, press Command + SHIFT + C . These key combinations will bring up the Inspect Element window, which allows you to view and edit HTML and CSS code for websites. You can also use this window to debug JavaScript code within a web page.
What Does Ctrl + Shift + C Do in Chrome?
Ctrl Shift C in Chrome is a shortcut that activates the Inspect Element mode, which allows you to inspect, edit, and debug HTML and CSS elements on a page. This feature can be used to diagnose display problems or to explore the structure of a webpage. When Inspect Element mode is activated, you can click on any element on the page to see its HTML code, and make changes within it. You can also view the styling associated with any element, and make adjustments as necessary.
Utilizing F12 in Chrome
F12 in Chrome is an incredibly powerful and versatile developer toolbox. It provides you with all the tools necessary to debug, inspect, diagnose and troubleshoot your webpages. F12 has various features such as a Console that allows you to enter JavaScript commands, a Network tab that lets you monitor HTTP requests, a Sources tab that lets you view and edit source files, an Elements tab that allows you to inspect the DOM tree of your page, and much more. F12 also allows you to emulate differet devices and browsers so that you can test how your page looks on various devices. It’s basically a one-stop shop for all your development needs!
Inspecting HTML in Chrome
In order to inspect HTML in Chrome, you need to access the Developer tools panel. This can be done by clicking on the tree vertical dots on Chrome’s top menu bar, choosing More tools, and then selecting Developer tools. Alternatively, you can use the keyboard shortcuts – Ctrl + Shift + I for Windows or Linux and Cmd + Option + I for macOS users. Lastly, you can right-click on the web page and choose Inspect to directly access the Developer tools panel. Once in the panel, you will be able to view and edit HTML code for any website.
Editing HTML Using Inspect Element
In order to edit inspect element in HTML, you will need to open the Developer Tools panel. If you are usig Google Chrome, you can do this by right-clicking on any area of the web page (including blank areas) and selecting ‘Inspect’ from the menu. Alternatively, you can access the Developer Tools panel by going to the Google Chrome settings menu (the three vertical dots in the upper right-hand corner of the browser window control panel), then selecting More Tools > Developer Tools.
Once the Developer Tools panel is open, you will be able to see all of your HTML code for that page. You can then make changes directly in this code, and those changes will be reflected in how the page looks. To save your changes, press Ctrl+S (or Cmd+S on a Mac). Please note that these changes are only temporary and will be lost when you close or refresh the page.
Editing Chrome’s Inspect Tool
To edit an element using Inspect in Chrome, right click the element you want to edit and select “Inspect” or “Inspect Element” from the drop-down menu. This will open up the Developer Tools pane at the bottom of your browser window. You can then make changes to the HTML or CSS code related to the element you selected. To save your changes, simply click the ‘Save’ icon in the upper-right corner of the Developer Tools pane. If you want to undo any changes you made, simply hit refresh on your browser and all unsaved changes will be discarded.
Inspecting HTML
Inspect in HTML is a built-in development tool in web browsers that allows developers to view and edit the HTML and CSS code of any webpage. It’s typically found in the browser’s menu, or by right-clicking on an element of a page and selecting ‘Inspect’. Inspect also includes useful features such as live editing, which makes it easy to test out changes while you are developing, as well as visual tools like rulers and grids. By using Inspect, developers can quickly identify errors in their code, enabling them to make changes faster and more efficiently.
Conclusion
Inspect Element is an incredibly useful tool for web developers, designers, and site managers. It allows users to quickly and easily view the source code of webpages and make changes on the fly. Through its intuitive interface, users can view HTML, CSS, JavaScript code, as well as images and other elements of a webpage. Its features also include editing any element’s properties without saving or reloading the page, adding breakpoints to pause JavaScript execution for debugging purposes, and quickly finding elements within a page. In addition to these features, Inspect Element also allows users to edit any element’s text or attributes without havng to write any code. This makes it an invaluable tool for those who are familiar with coding or just want a quick way to make changes to their websites.


