The console is an essential tool for developers and SEO experts alike. It allows you to examine and troubleshoot your code, track performance, and analyze website errors. In this article, we will focus on how to open the console in Chrome, one of the most popular web browsers.
There are several ways to access the console in Chrome. Let’s explore a few options:
1. Chrome DevTools Shortcut: The quickest way to open the console is by using the Chrome DevTools shortcut. Simply press F12 on Windows or Linux, or Option + ⌘ + J on macOS. This will bring up the DevTools panel, where you can find the Console tab.
2. Right-click and Inspect Element: Another method is to right-click on any element on a webpage and select “Inspect Element” from the context menu. This will open the DevTools panel, with the Console tab already selected.
3. Keyboard Shortcut: If you prefer using keyboard shortcuts, you can open the console directly by pressing Ctrl + Shift + J on Windows or Linux, or Cmd + Option + J on macOS.
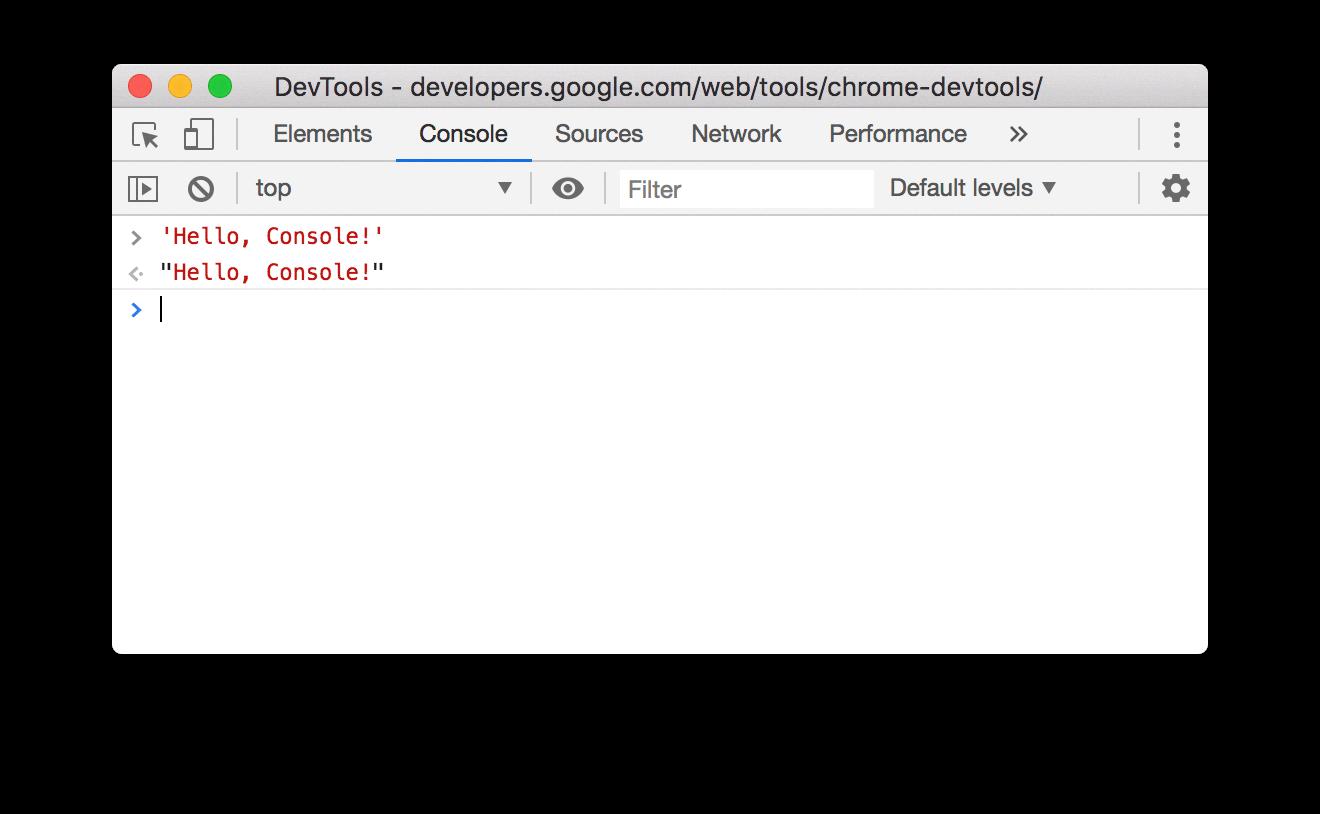
Once you have opened the console, you will see a command line interface where you can type JavaScript code and execute it. You can also view any error messages or log messages generated by your website.
The console provides a wide range of features and functionalities. You can use it to test JavaScript code, debug issues, analyze network requests, measure website performance, and much more. It is a powerful tool that can greatly enhance your SEO efforts.
In addition to opening the console, you can also customize its appearance and behavior. For example, you can change the console’s theme, enable or disable logging, filter messages, and set breakpoints for debugging purposes.
Remember, the console is not only useful for developers. As an SEO expert, you can leverage its capabilities to identify and fix website errors, optimize code performance, and improve overall website quality.
The console in Chrome is a valuable tool for developers and SEO experts. It allows you to analyze and troubleshoot code, track performance, and optimize your website. By following the methods mentioned above, you can easily open the console in Chrome and start harnessing its power. Happy coding!
How Do I Use Console In Chrome?
To use the console in Chrome, follow these steps:
1. Open Google Chrome on your computer.
2. Press the F12 key on your keyboard (or Option + ⌘ + J on macOS). This will open the Chrome Developer Tools.
3. The Developer Tools window will appear either at the bottom or on the right side of the browser window.
4. In the Developer Tools window, select the “Console” tab.
5. Now you can start using the console to interact with and analyze your code.
The console is a powerful tool that allows you to execute JavaScript code and view the output directly in your browser. It can be used for various purposes, such as debugging and troubleshooting code, testing JavaScript functions, and monitoring network requests.
Here are some key features and functionalities of the Chrome console:
– Logging: You can use the console.log() function to print messages or variables to the console for debugging purposes.
– Executing code: You can directly type and execute JavaScript code in the console, allowing you to test individual lines of code or run functions.
– Error messages: If there are any errors in your code, the console will display error messages that can help you identify and fix the issues.
– Network monitoring: The console also provides a network tab where you can view HTTP requests, responses, and other network-related information.
– Performance analysis: You can use the console to measure the performance of your code, such as execution time and memory usage.
By using the Chrome console, you can gain valuable insights into your code and optimize its performance. It is a handy tool for developers and SEO writers alike to improve their website’s performance and functionality.

How Do I Open The Console Key In Chrome?
To open the console in Chrome, there are a few different methods you can use. Here are the steps for each method:
Method 1: Right-click and select Inspect Element
1. Start by opening Google Chrome on your computer.
2. Go to the webpage where you want to open the console.
3. Right-click anywhere on the page to open the context menu.
4. In the context menu, select the “Inspect” or “Inspect Element” option. This will open the Chrome Developer Tools panel.
5. Once the Developer Tools panel is open, you will see several tabs at the top. Click on the “Console” tab to switch to the console view.
6. The console will now be visible, and you can start using it to run JavaScript code or view any error messages.
Method 2: Using keyboard shortcuts
1. Open Google Chrome on your computer.
2. Go to the webpage where you want to open the console.
3. Use the following keyboard shortcut to open the Developer Tools and bring focus to the console:
– For Windows: Press Ctrl + Shift + J.
– For Mac: Press Cmd + Opt + J.
4. The Developer Tools panel will open, and you will be automatically taken to the console view.
5. You can now use the console to execute JavaScript code or analyze any errors.
Method 3: Using the Chrome menu
1. Launch Google Chrome on your computer.
2. Go to the webpage where you want to open the console.
3. Click on the three-dot menu icon in the top-right corner of the Chrome window.
4. In the dropdown menu, hover over the “More Tools” option, and another menu will appear.
5. From the second menu, select “Developer Tools.” This will open the Developer Tools panel.
6. In the Developer Tools panel, click on the “Console” tab to switch to the console view.
7. The console will now be visible, and you can start utilizing it for running JavaScript code or examining any error messages.
By following these steps, you will be able to open the console in Google Chrome using different methods.
How Do I Open The Inspect Console In Chrome?
To open the inspect console in Chrome, you can follow these steps:
1. Launch Chrome by clicking on its icon on your desktop or by searching for it in your computer’s applications.
2. Once Chrome is open, navigate to the webpage you want to inspect.
3. To open the Chrome DevTools, you have a few options:
– Press the F12 key on your keyboard.
– Right-click anywhere on the webpage and select “Inspect” from the context menu.
– Alternatively, you can access the DevTools by clicking on the three vertical dots at the top right corner of the Chrome window, selecting “More Tools”, and then choosing “Developer Tools”.
4. After opening the DevTools, you will see a separate panel appear on the right or bottom of the browser window. This panel is the Chrome DevTools interface, which provides various tools for inspecting and debugging web pages.
5. By default, the “Elements” tab will be selected, displaying the HTML structure of the webpage you are inspecting. To access the console, click on the “Console” tab in the DevTools panel.
6. The console will appear, allowing you to enter JavaScript commands and view any errors or output generated by the webpage.
In summary, to open the inspect console in Chrome, you can use the keyboard shortcut F12, right-click and select “Inspect”, or access it through the Chrome menu. Once the DevTools interface is open, click on the “Console” tab to access the console.
How Do I See The Browser Console?
To access the browser console in Chrome, follow these steps:
1. Open the Chrome browser on your computer.
2. Press the keyboard shortcut Cmd-Shift-J on Windows or Cmd-Option-J on a Mac. This will open the developer console window.
3. Alternatively, you can right-click anywhere on a webpage and select “Inspect” from the context menu. This will open the developer tools panel, and the console tab will be automatically selected.
Once the console is open, you can view and analyze various types of information, including errors, warnings, network requests, and JavaScript output. It is a powerful tool for developers and can help in debugging and troubleshooting website issues.
Here are some features and functions you can use within the console:
– Logging: You can use the console.log() function to print messages or variables to the console. This is helpful for debugging and understanding the flow of your code.
– Inspecting elements: You can use the “Elements” tab in the developer tools panel to inspect and modify the HTML and CSS of a webpage. This can be useful for understanding the structure and styling of a webpage.
– Network monitoring: The “Network” tab allows you to monitor network requests made by a webpage. You can view details such as request/response headers, status codes, and response data. This can help in analyzing performance and troubleshooting network-related issues.
– JavaScript execution: You can directly execute JavaScript code in the console. This can be useful for testing small snippets of code or experimenting with website functionality.
– Error tracking: The console displays any JavaScript errors that occur on a webpage, making it easier to identify and fix issues.
– Performance analysis: The “Performance” tab provides insights into the loading and rendering performance of a webpage. It can help in optimizing the speed and efficiency of a website.
The browser console in Chrome is a powerful tool for developers. It allows you to view and analyze various types of information related to a webpage, helping you debug, troubleshoot, and optimize your website.
Conclusion
The console is a powerful tool provided by Chrome’s developer tools that allows users to analyze and debug their code. It can be accessed through various methods, such as right-clicking on a page element and selecting “Inspect Element” or using keyboard shortcuts like F12 or Cmd-Shift-J.
The console provides a user-friendly interface where users can view and interact with their code, making it easier to identify errors and optimize performance. It offers a range of features, including logging and debugging capabilities, as well as the ability to execute commands and evaluate expressions in real-time.
By utilizing the console, SEO writers can effectively test and troubleshoot their code, ensuring that their website is optimized for search engines. It allows them to monitor the performance of their website, identify any issues or errors, and make necessary adjustments to improve overall SEO.
The console is a valuable tool for SEO writers, providing them with the means to analyze and optimize their code for better search engine visibility. By utilizing this tool, SEO writers can ensure that their websites are performing at their best, ultimately driving more traffic and improving their search rankings.


